Two Charts Can Lie: What Separates Instruments
Put a EURUSD chart and a palladium chart side by side, hide the labels, and they look like the same game: candles, levels, pullbacks. They are not the same game. Six weeks of vetting instruments before allowing them into my playbook produced a short list of properties that actually matter — and one spectacular example of why the vetting exists at all.
The bar that hunts stops on its own
XPDUSD (palladium) on my broker's feed prints a bar at 23:00 — the daily rollover — that behaves like no other hour. The open and close barely move. The lower wick plunges: −127.6 points on 10 August, −125.8 and −95.4 the two nights after. Measured across 173 rollovers, the 23:00 bar has a lower wick deeper than 2% of price in 6.9% of cases, against 0.8% for every other hour of the day. Its median range is 3.0× a normal hour, and the asymmetry is entirely one-sided: the spike goes down, not up.
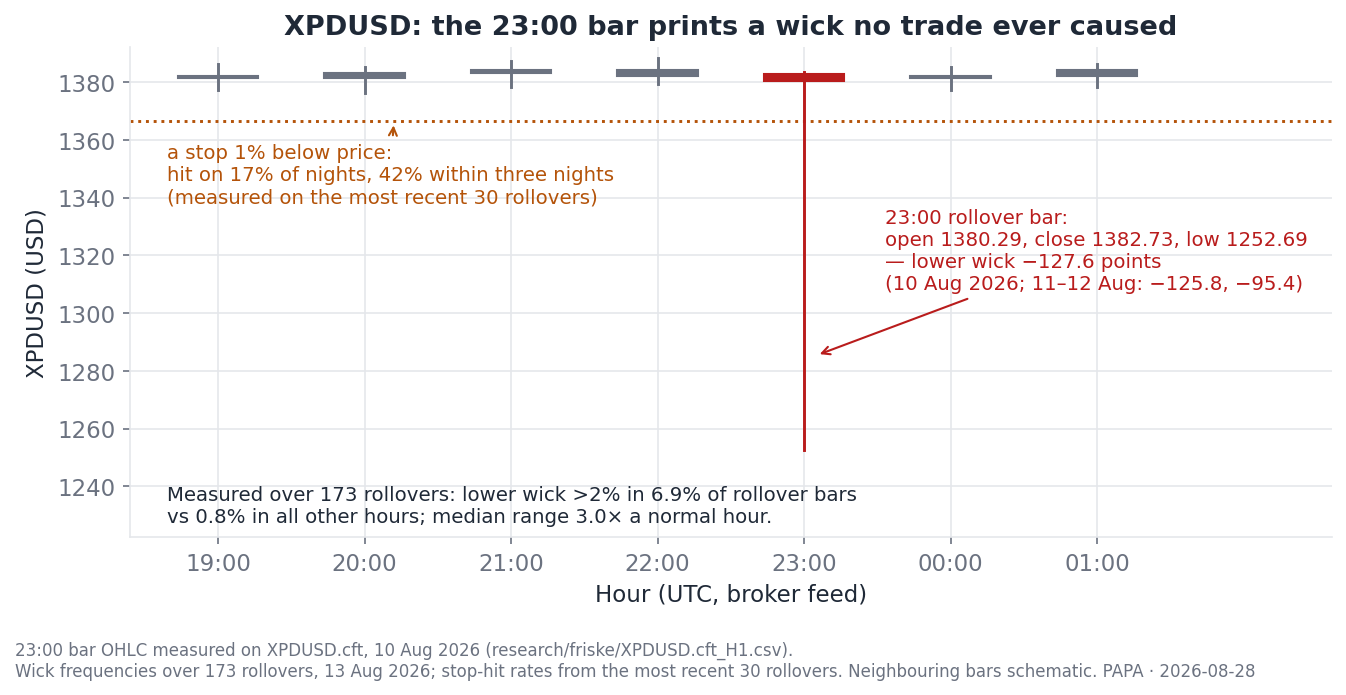
Real volatility hits both directions. This doesn't — because it isn't price discovery at all. It is a feed artifact around the daily rollover. And here is why it matters to a position rather than to a statistician: MT5 builds the bar's low from the BID. The spike is a bid quote, so it does trigger a long's stop-loss, even though no trade ever printed down there. A stop placed a sensible 1% below price gets hit on 17% of nights — 42% if you hold three nights. Those two numbers come from the most recent 30 rollovers, not from the full 173: the frequency of the artifact is measured on all 173, the odds of it reaching your stop on the last 30. To survive the spike band the stop must sit 3% or more away, and at that distance no realistic target pays for the risk.
Conclusion for the playbook: XPDUSD is excluded. Not "traded carefully" — excluded. And every new instrument now gets its rollover bar measured before its first trade. One night of data would have looked like bad luck; 173 rollovers make it a property.
The checklist that actually separates instruments
Beyond the rollover check, these are the properties I measure before an instrument is allowed in — each one has changed at least one decision:
- Spread — as a share of your stop, not in points. A 2-point spread is irrelevant on a 200-point stop and ruinous on a 12-point stop. I compute spread ÷ (0.75 × H4 ATR): what the entry costs relative to a typical structural stop.
- Swap — converted to R per night. The formula needs no lot size:
swap in R per night = swap points × point size ÷ stop distance. Measured on my instruments: XPTUSD long costs 0.80% of one R per night, XAUUSD 1.24%, XPDUSD 2.15%, USDZAR 5.4%. A USDZAR position held ten nights has silently paid over half an R in carry — that either belongs in the plan or the plan is wrong. - Contract size and tick value — from the terminal, per account. The same symbol can be a 100× different contract at two brokers (that story is its own article). And the terminal's own tick-value field can simply be wrong in a way that looks correct: a sweep of all 712 symbols on one broker found five indices —
EUSTX50.cft,FRA40.cft,E35EUR.cft,UK100.cftandJPN225.cft— reporting a tick value hundreds of thousands of times too high (four of them showed the flat, round number 1,000,000.00; the fifth showed 100.00). A dead field showing zero breaks a formula loudly — division by zero, the program stops. A round, plausible-looking number doesn't: a lot-size formula that trusts it silently sizes a position hundreds of thousands of times too small, rounds up to the minimum, and sends an order that looks completely normal. The only way to catch it is to derive the notional value twice — once from the tick value, once independently from the broker's own margin calculation — and refuse to size a trade when the two disagree. - Weekend gaps. Some instruments reopen after the weekend somewhere else entirely — and note that "the reopen" is not Monday morning: on my main broker the first bar after the pause is Sunday at 22:00 on the server clock. Measured on my universe, the gap exceeds a 1-ATR stop in 21% of weekends — and the direction is not neutral (measured in its own article).
- Rollover behaviour. The XPDUSD check above, run as a script across every instrument in my data before it can be traded. Of 24 instruments measured, exactly one flunked. That number needs the caveat my own report attached to it: those 24 are mostly FX majors plus a few indices and metals, and an FX major is precisely where you would not expect this artifact. So "1 of 24" mostly says that my current book is clean — not that the artifact is rare. It lives in thin instruments, and thin instruments are the ones I hadn't measured. That is the real argument for vetting: not paranoia, but that you don't know what you haven't measured, and the one is expensive to find live.
The meta-lesson
Notice what is not on the list: nothing about which instrument "trends better" or "respects technicals". Those beliefs didn't survive measurement on my data. What separates instruments in practice is microstructure and cost — properties you can measure once, before ever risking a trade, and that quietly decide whether a good setup can be executed at all.
This vetting layer is being built into PAPA (the prop-firm journal I'm building) as the instrument check: rollover profile, gap statistics, spread and swap in R — run automatically before the first trade in anything new, because the alternative is finding out the way I nearly did at 23:00.
One trader's measurements on one broker's feed, described for education. Not investment advice.
PAPA is the prop-firm journal these measurements are being built into — instrument checks, firm rules and compliance buffers, running on your own machine.
Get PAPA — free