I Measured What a Weekend Actually Costs
Every trader who holds positions has had the Friday feeling: keep it over the weekend, or flatten? Most answers you'll find are vibes — "never hold", "gaps always fill", "it depends". I got tired of the vibes and measured it on my own instrument universe: every Friday close against the first bar after the weekend pause.
That last part matters more than it sounds. The first bar after the pause is not Monday morning. On my main broker the last Friday bar closes at 22:00 on the server clock and the market reopens Sunday at 22:00 on the same clock — 23:00 on the metals, and Monday 00:00 on some of the indices. If you go looking at Monday's opening candle you will not find these numbers, because by Monday the reopening move has already happened and mostly unwound.
The sample: 4,305 weekends across 45 symbols, crypto excluded — BTC, ETH and the other coins don't take a weekend off, and they would have polluted the measurement. The data is my broker's H4 history, roughly two years per symbol (July 2024 to August 2026 for the longest series). Each gap is measured in the symbol's own ATR, so a 40-pip jump on USDCHF and a 400-point jump on an index are compared on the same scale. Two weekends were thrown out as data errors (gaps of several hundred ATR are a feed glitch, not a market).
Two numbers came out that changed how I plan Fridays.
First: gaps jump stops more often than intuition says. In 21% of weekends, the gap was larger than a stop placed at one full ATR — meaning that roughly one weekend in five, a normally-placed stop doesn't protect you at its price; you are filled wherever the market reopens. Tighten the stop to 0.8 ATR and it's 27%. At half an ATR it's 43%. The tighter your stop, the more of your protection the weekend confiscates. Even a stop at 1.5 ATR — wide, by most people's standards — gets jumped in one weekend out of eight.
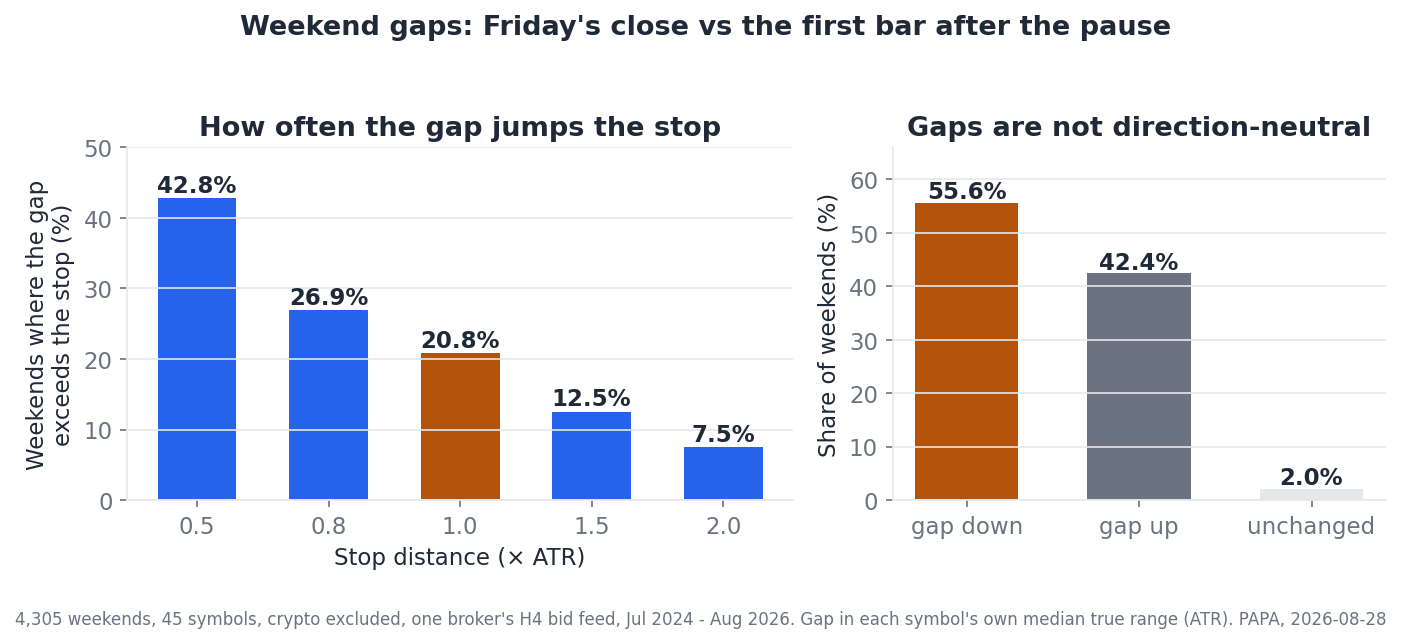
Second — and this is the one nobody told me: the gaps have a direction. 56% of weekend gaps in my measurement opened down, 42% opened up, and 2% reopened exactly where they closed. On 4,305 weekends that is nowhere near a coin-flip — the odds of a fair coin producing a split this lopsided are effectively zero. An earlier run in August on a second broker's feed leaned the same way; that data is no longer on my disk, so its numbers are not in the chart.
Why they lean down — an interpretation, not a measurement
Before you build anything on that 56/42, you need the caveat my own report insists on, because it changes what the finding is.
MT5 builds its bars from the bid. Friday's close is the last bid before the pause; the reopen is the first bid after it — and the reopening spread is enormous. A wide spread drags the bid down relative to the mid, which means a "gap down" is partly the spread and not a price movement at all.
The shape of the reopening bar supports that reading. It opens inside its own bottom fifth in 42% of cases, against 20% if the open sat at random inside the bar. That is precisely what a very wide spread that then narrows looks like when the bars are built on bid.
So: interpretation, not measurement. Weekend spread was never measured directly, and a genuine market phenomenon isn't ruled out. What doesn't change is what it does to an open position — a long still gets hit, and a stop is still filled on the bid — but I am not going to sell you a market asymmetry when the data only supports a bid artifact. Plan around the fill you'll actually get; don't build a theory on top of it.
What a stop is worth over a weekend: nothing at its price
The mechanical point first, because it is absolute: a stop-loss does not limit your loss across a gap. It converts into a market order at the reopen. If price reopens beyond your stop, you are out at the opening price, not the stop price. The 21% number above is how often that mechanism actually mattered on my data — it is not an edge case.
So the honest way to size a Friday hold is to size it against the gap, not against the stop: "if the market reopens 1.5 ATR against me, what does this position lose?" If that number is unacceptable, the position is too big for a weekend — whatever the stop says.
And it is not the same for every instrument. The median weekend gap across the whole universe is 0.41 ATR, but natural gas (XNGUSD) reopens a full ATR away from Friday's close in half of all weekends, and palladium, USDMXN and the French index all sit around 0.65–0.7 ATR. Weekend gap belongs on the same list as spread and swap: a property of the instrument, measured once.
An asymmetry to account for — not a signal
Let me be precise about what the 56/42 finding is and isn't. It is not a strategy. "Short everything on Friday" is not what the data supports — it is a 56/42 split on a bid feed, with a spread explanation nobody has ruled out. What it is, is an asymmetry that belongs in the plan, because the fill lands on your account either way:
- A long held over a weekend deserves a size cut or a hedge-check that a short of the same quality doesn't need.
- A marginal long on Friday afternoon is easier to skip than the same setup on Tuesday. The rejection costs little; the gap risk is real.
- A short isn't "safe" — 42% of gaps went up. It just isn't carrying the extra weight.
The Friday routine that came out of it
- Before Friday's last session: list every open position and every pending order that could fill near the close.
- For each: compute the loss at a 1.5-ATR adverse reopen — not at the stop.
- Longs get the harder look, per the asymmetry above.
- Log what you decide, including "held, accepted the gap risk". A decision you didn't write down can't teach you anything in three months.
I run this as a measured routine because my journal — and PAPA, the prop-firm journal I'm building from it — treats the weekend as a property of an instrument, like spread or swap: something you measure once, per market, instead of re-feeling every Friday. For prop traders it matters more than for anyone else: firms' trailing drawdown doesn't pause over the weekend, and a weekend gap that jumps your stop can take a rule breach with it. (The other properties on that list are in Two Charts Can Lie: What Separates Instruments.)
One trader's measurements on his own instrument universe: 4,305 weekends across 45 symbols, crypto excluded. That is a large sample by the standards of anything else on this site — but it is one broker's bid feed, and the directional finding has a spread explanation that has not been ruled out. Treat the numbers as method, not prophecy. Not investment advice.
PAPA is the prop-firm journal these measurements are being built into — instrument checks, firm rules and compliance buffers, running on your own machine.
Get PAPA — free